Configuring Metrics
Metric management is performed through the Ignite CLI tool.
Listing Metric Sources
You can list all available metric sources for a node or for the entire cluster.
node metric source list
cluster metric source list
Listing Metrics
You can list all metrics for a node.
To see the list of metrics, you need to enable the relevant metric sources - see Enabling Metric Sources.
node metric list
The above command returns the list of all currently available metrics organized with their exporters.
Enabling Metric Sources
Metric collection might affect the performance of an application. Therefore, by default, all metric sources are disabled.
Metric sources can be enabled:
- On per-node basis - you can specify the node to interact with by using the
-uparameter to specify node URL or-nparameter to specify node name. - For the entire cluster.
For example:
node metric source enable -n=defaultNode jvm
cluster metric source enable jvm
Disabling Metric Sources
Metric sources can be disabled:
- On per-node basis - you can specify the node to interact with by using the
-uparameter to specify node URL or-nparameter to specify node name. - For the entire cluster.
For example:
node metric source disable -n=defaultNode jvm
cluster metric source disable jvm
Configuring Metrics Exporters
To access the collected metrics with external tools, you need to configure metrics exporters.
JMX
The JMX exporter provides information about Ignite nodes in JMX(Java Management Extensions) format. When the exporter is enabled, the node exposes the metrics to monitoring tools.
You can enable the JMX exporter in the following way:
cluster config update ignite.metrics.exporters.myJmxExporter.exporterName=jmx
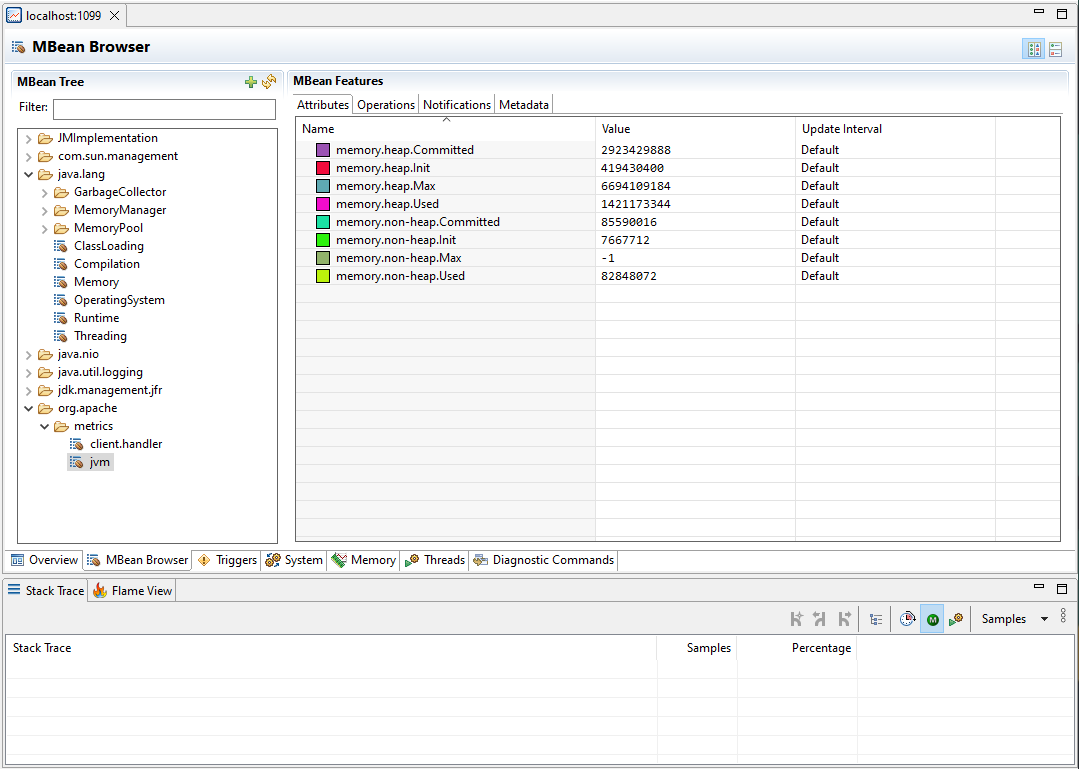
After you do, JMX monitoring tools will be able to collect enabled metrics from the specified nodes:

You can also open internal JDK modules required for JMX, enable the remote JMX agent, configure the connection port, authentication, and SSL. Add the following JVM options to your Ignite node configuration:
--add-opens=jdk.management/com.sun.management.internal=ALL-UNNAMED

-Dcom.sun.management.jmxremote
-Dcom.sun.management.jmxremote.port=<PORT_NUMBER>
-Dcom.sun.management.jmxremote.authenticate=true|false
-Dcom.sun.management.jmxremote.ssl=true|false
Log Exporter
Log exporter writes metrics data to the application log, so they can be consumed by log collectors or inspected manually. To configure it, use the following parameters:
| Name | Description | Default value |
|---|---|---|
| periodMillis | Export interval for the metrics, in milliseconds. | 30000 |
| oneLinePerMetricSource | Define whether to print all metrics from one metric source on a single log line. | true |
| enabledMetrics | List of enabled metric sources. If this list is non-empty, only the listed metric sources will be printed, all others will be skipped. A wildcard can be used to match a prefix (for example, jvm.*). By default, the metrics of some background activities are printed. | "metastorage", "placement-driver", "resource.vacuum" |
To add log exporter to cluster exporters list, run the following command and define all the metrics to print in enabledMetrics list:
cluster config update ignite.metrics.exporters.logPush '{"exporterName":"logPush","periodMillis":30000,"oneLinePerMetricSource":true,"enabledMetrics":[]}'
Updated exporters configuration should look like this:
exporters=[
    {
        enabledMetrics=[]
        exporterName=logPush
        name=logPush
        oneLinePerMetricSource=true
        periodMillis=30000
    }
]
OpenTelemetry
The OpenTelemetry exporter connects to an OpenTelemetry service that is provided in configuration and sends cluster information to it. Each node sends metrics independently, and requires access to the specified endpoint.
The example below shows the basic OpenTelemetry configuration. As OpenTelemetry services require different URL formats and may require headers, this example may not work for your environment.
cluster config update ignite.metrics.exporters.test: {exporterName:otlp, endpoint:"http://localhost:9090/api/v1/otlp/v1/metrics", protocol:"http/protobuf"}
OpenTelemetry exporter created by this command will look like this:
{
        compression=gzip
        endpoint="http://localhost:9090/api/v1/otlp/v1/metrics"
        exporterName=otlp
        headers=[]
        name=test
        periodMillis=30000
        protocol="http/protobuf"
        ssl {
            ciphers=""
            clientAuth=none
            enabled=false
            keyStore {
                password="********"
                path=""
                type=PKCS12
            }
            trustStore {
                password="********"
                path=""
                type=PKCS12
            }
        }
    },
Below are the descriptions of configuration parameters:
| Name | Description | Default value |
|---|---|---|
| compression | How the payload is compressed. Possible values: none, gzip. | gzip |
| endpoint | The OpenTelemetry endpoint. Each node resolves the endpoint individually. | |
| exporterName | Exporter name. Must be otlp to use OpenTelemetry. | |
| headers | Request headers, if any. | |
| name | User-defined exporter name, used to refer to it in Ignite. | |
| periodMillis | Export interval for the metrics, in milliseconds. | 30000 |
| protocol | The protocol that is used to send OpenTelemetry data. Possible values: grpc, http/protobuf. | grpc |
| ssl.ciphers | List of ciphers to enable, comma-separated. Empty for automatic cipher selection. | |
| ssl.clientAuth | Whether the SSL client authentication is enabled and whether it is mandatory. | |
| ssl.enabled | Defines if SSL is enabled. | false |
| ssl.keyStore.password | SSL keystore password. | |
| ssl.keyStore.path | Path to the SSL keystore. | |
| ssl.keyStore.type | Keystore type. | PKCS12 |
| ssl.trustStore.password | Truststore password. | |
| ssl.trustStore.path | Path to the truststore. | |
| ssl.trustStore.type | Truststore type. | PKCS12 |
Connection to Grafana
When connecting to Grafana Cloud, you need to use the protobuf protocol and pass the authorization header in the configuration:
cluster config update ignite.metrics.exporters.test: {exporterName:otlp, endpoint:"https://otlp-gateway-prod-eu-west-2.grafana.net/otlp", protocol:"http/protobuf", headers {Authorization.header="Basic myBasicAuthKey"}}
Connection to Prometheus
When connecting to Prometheus, you need to use the protobuf protocol and send metrics to the /api/v1/otlp/v1/metrics after the OTLP metrics receiver is enabled as described in Prometheus documentation:
cluster config update ignite.metrics.exporters.test: {exporterName:otlp, endpoint:"http://localhost:9090/api/v1/otlp/v1/metrics", protocol:"http/protobuf"}